
Player wiki
The market
9 goods, each with a price that moves on its own — deterministically, from the run's seed. You are not guessing at randomness, you are reading a system.
The 9 goods
| good | base price | volatility | floor | ceiling | unlocked by |
|---|---|---|---|---|---|
| ENERGY | 1 | 4.5 % | 0.24 | 30 | from the start |
| COPPER | 12 | 4.5 % | 2.4 | 300 | from the start |
| IRON | 8 | 4 % | 1.6 | 200 | from the start |
| SILICON | 45 | 5.5 % | 9 | 1.12K | from the start |
| STEEL | 120 | 5 % | 24 | 3.00K | MASS PRODUCTION |
| TITANIUM | 800 | 6 % | 160 | 20.0K | TITANIUM |
| CARBON | 2.50K | 6 % | 500 | 62.5K | CARBON FIBER |
| GRAPHENE | 12.0K | 7 % | 2400 | 300K | GRAPHENE |
| QUANTUM | 250K | 8 % | 50000 | 6.25M | MATTER COMPILER |
During a shortage event — one that pushes a price above base — that good becomes impossible to buy. You cannot jump on a moving train: stock is built before the crisis, which is the entire point of holding materials.
How prices move
A deterministic random walk, pulled back towards the base price. Same seed, same prices — reloading a save does not reroll the market.
| setting | value |
|---|---|
| One price step, seconds | 2 |
| Pull back towards base price, % of the gap per step | 1.2 |
| Floor, × base price | 0.2 |
| Ceiling, × base price | 25 |
| Glide during an event, % of the gap per step | 8 |
| Points kept in the live chart | 32 |
| One point every, seconds | 10 |
| Event marks kept on the axis | 8 |
The price you post
The energy going down the SELL lane leaves at the price you set. Buyers pay your price, and take less of it the dearer you are:
share sold = min(cap, (market price ÷ your price) ^ 4)
Your posted price is bounded by the base price of energy (1.2): from ×0.5 to ×10, so 0.6 to 12.
| your price | × base | share sold | with FLASH SALES | relative income |
|---|---|---|---|---|
| 0.6 | ×0.5 | 1 | 2 | ×0.5 |
| 1.09 | ×0.91 | 1 | 1.456 | ×0.91 |
| 1.99 | ×1.66 | 0.133 | 0.133 | ×0.22 |
| 3.62 | ×3.02 | 0.012 | 0.012 | ×0.036 |
| 6.59 | ×5.49 | 0.001 | 0.001 | ×0.006 |
| 12 | ×10 | 0 | 0 | ×0.001 |
Where is the optimum? Without FLASH SALES, income peaks exactly at the market price: going above drops the share sold faster than the price climbs (elasticity 4 beats 1), and going below sells no more than everything. With FLASH SALES the cap becomes 2, and the sweet spot moves under the market: posting ×0.841 the market price also drains your battery and earns ×1.682 what the market price would.
Charts and alerts
| scale | one candle | window shown |
|---|---|---|
| LIVE | 10 s | 320 s |
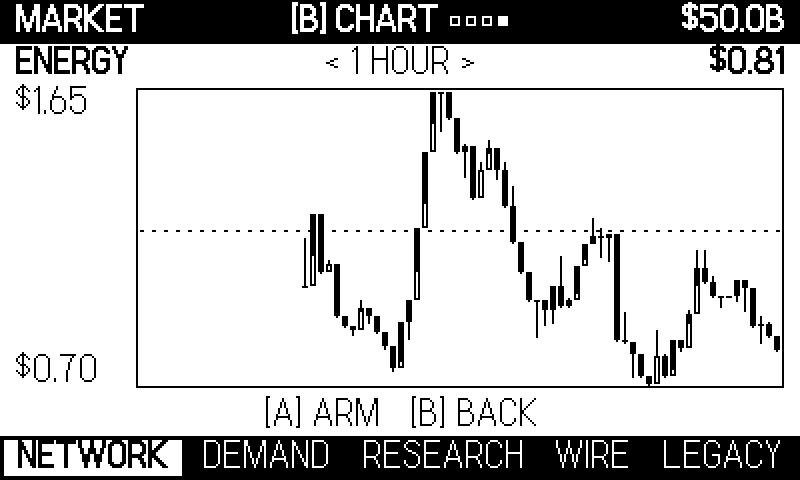
| 1 HOUR | 60 s | 60 min |
| 8 HOURS | 600 s | 8 h |
A hollow candle closed up, a filled one closed down, and the wick is the range. The dotted line across the chart is the good's base price, so dear and cheap read in absolute terms rather than by feel. Marks on the axis show where a price event hit — the last 8. Armed alerts are yours to place: you set a line with the crank and arm it with A. It fires once, on the side you set it from, and the tab blinks. The number of lines you get comes from the tree — TRADING FLOOR and its neighbours.
Haggling
A buyer sometimes turns up in person. They open at ×1.5 the going price, and every crank of the handle pushes them ×1.02 higher — while their patience runs from 8 to 20. Push too far and they walk. It is the one place in the game where the crank is a negotiation rather than a power supply, and the achievement  TALKED HIM UP asks you to close at double the going rate. Closing well is also filed at the office: a deal that beats ×1.75 the base price drops a notch at the depot, and one that beats ×2 drops two. The market is one of the fastest ways to a patent — see Research.